
One of my favourite trading methods is pullbacks in both rising and falling markets. It’s based loosely on a book by the Connors Group called “The Alpha Formula“
Here’s how I do it.
I use my favourite filter tool, Sharepad, to identify suitable opportunities. There are three criteria which I use to filter various markets. These are:
- the % change over the last 60 trading days. I set the minimum percentage to be 5%.
- the weekly RSI (2) crosses below 10 in the last trading day.
- the 100 day volatility
The Relative Strength Indicator (RSI) is a momentum indicator and you can read all about it here.
To set up the % change over the last 60 days, login to Sharepad and click on “Add Criteria”. Across the top you’ll see a number of categories and the one you want to select is “Price”. Scroll down to the section marked “Price change” and select the “Since date” option. Then set up the various options to look like this:

To add “the weekly RSI (2) crosses below 10 in the last trading day” criteria, click on “add criteria” and then across the top select “Technical”. Now scroll down the left hand side until you get to indicators and select the RSI option. You’ll be presented with a number of options which you need to set up as shown below:

To include the “Volatility” criteria, you again select the “Add Criteria” to reveal the pulldown menu. Across the top of this pulldown you’ll see a number of different categories and the one you want is “Technical”. Once you’ve clicked this scroll down to the indicators options on the left hand side and you’ll see “Volatility”. Click on this and you’ll then see a number of setup options. Setup the options so they look like this:

That’s all the settings completed and all we need to do now is to select various lists to filter according to these criteria. Sharepad offers various different lists as shown below:

The main lists that I use are:
- AIM 100
- NASDAQ 100
- US 500
- Major indices
- FTSE 350
- US shares
- UK ETFs
- Exchange Traded Funds
Run these various lists against the options we previously set up to find suitable candidates for trades.
All the above are for rising markets.
To find shorting candidates in a falling market we use the same criteria but set the “% change since 60 trading days ago to a maximum of -5% rather than a minimum of 5%.
The state of the market is very important. I trade a maximum of 8-10 positions at once and in a generally rising market I should therefore have more long trades (betting the trade price will rise) than short trades (betting that the trade price will fall). Even then I will have a proportion of short trades as a hedge in case the market turns or pullbacks. As an example, in a rising market I will have 6-7 long positions and 3-4 short positions. In a falling market I will have the reverse positions.
As an example of a short trade in a generally rising market (i.e. the 20 week exponential moving average is rising) I will select short trades for individual positions where an individual stock is falling.
if I filter on US shares today, 11th December, I get the following list of shares which meet the shorting criteria:

Generally speaking I prefer the ones with higher volatility since we need volatility to make the shares move and therefore present opportunities to run successful trades. In this case I look through the various shares until I see one that has a downward trend and has a reasonable probability of continuing that trend. In this case the one that looks like it presents the best opportunity is Unitil Corp despite the fact that it has the lowest volatility of the six shares that meet our criteria.
The chart looks like this:
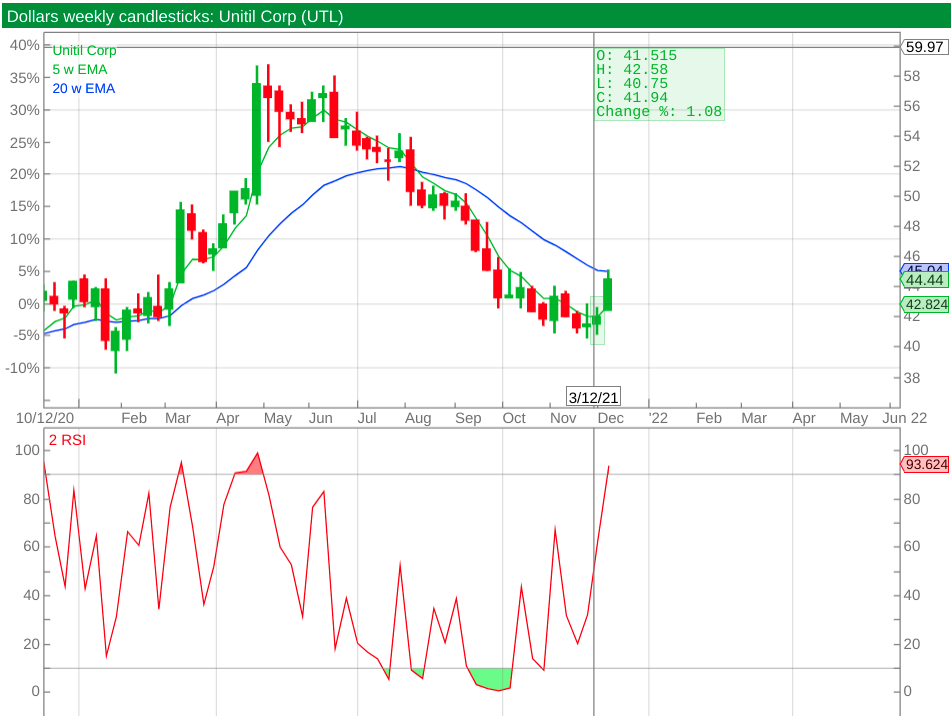
You can see that we have a downward trend as shown by falling 20 week exponential moving average but the share has pulled back towards the moving average line in the last week such that the 2 period RSI is above 90 (you can see that the value is actually 93.624)
This looks like a suitable trade so it’s worth checking the chart on your chosen trading platform (in this case I use IGIndex). The chart looks like this:

This matches what we have already seen in Sharepad and I’ve added another indicator called “Average True Range” or ATR for short. This is used to set the stop distance. In this case the value of the 12 period ATR is 256 which i round to 250.
When I enter the trade I set the the stop to 1 ATR from the trade entry price. I prefer to use fixed stops which I move manually as required.
The problem with a trailing stop in this strategy is that the stop will continue to remain one ATR away from the current price and this is not normally enough to avoid being stopped out over my preferred trading hold period of 1-3 months. Instead I prefer to watch the price and if it goes in my favour significantly I move the stop to the opening trade price i.e. breakeven.
At this point the trade become zero risk providing the instrument being traded does not gap significantly against me.
Once i’ve set the stop, it’s a simple calculation to calculate the position size. I tend to use a size of 1-2% of my total trading bank. if I assume that my bank is £100000 and the size is 2% of the trading bank, then the total risk is £2000 and the trade size is 2000 divided by the stop of 250. This gives a trade size of £8 a point.
We can now place the trade at a price of 4434, with a fixed stop at 4684 at £8 a point. I’ll monitor the trade over the coming weeks and report back on progress!
i’ve used this strategy in a number of markets, both rising and falling and have found it gives me a good trading edge. i generally trade around 8-10 trades at once in a long short portfolio (meaning I have both long trades and short trades in the portfolio) and also using a small number of different strategies which are not correlated. This has the effect of smoothing the resulting equity curve, with less pronounced drawdowns.
I’ll post more about some of my other strategies in future posts.
Leave a Reply